Absorbance
Normal serum obtained from an individual in good health is usually clear, pale yellow in color. However, the color of the patient’s serum may appear different for various reasons such as disease or improper handling of the blood specimen.
Lipemia (Lipe) results from increased levels of lipoproteins associated with triglycerides, and it can cause the serum to appear white.
Hemolysis (Heme) is caused usually by the release of hemoglobin from ruptured red blood cells during sample collection or sample handling. This interference can cause the serum to appear red.
Icterus (Icte) is the result of increased levels of bilirubin, and it can cause the serum to appear deep yellow or orange.
Abnormal serum colors may appear in some photometric assays, affecting the reliability of test results.
The Serum Indices feature of the ADVIA Chemistry System can detect and produce a qualitative estimate for the compounds associated with these three major serum interferences.
It achieves this by using absorbance measurements of samples that are diluted in saline and dispensed with the reagent 1 of a specific assay. During the course of Sample and R1 incubation, absorbance values are collected at the following three sets of wavelengths in addition to those that monitor the assay reaction.
|
Interference |
Primary |
Secondary |
|
Lipemia |
658 nm |
694 nm |
|
Hemolysis |
571 nm |
596 nm |
|
Icterus |
478 nm |
505 nm |
These index absorbances are collected at read points 6, 7, and 8. The median absorbance is displayed on the system printout and is used in the calculation of an index value. The index value is compared to the qualitative judgment set and may report a flag where appropriate.
The default judgment flags are set to produce a range from a minus symbol (-) to four pluses (++++), although the flag symbols can be customized for individual laboratories.
When the Qualitative Judgment option on the Analytical Parameters (Serum) window is set to DO, the measured absorbances are corrected using default factors entered into the appropriate column (a to f). The resulting corrected absorbance is compared to the corresponding Qualitative Judgment Settings to determine the reported flag level.
Both the Factors and the Qualitative Judgment Settings are established by analysis of standard solutions of the interfering materials.
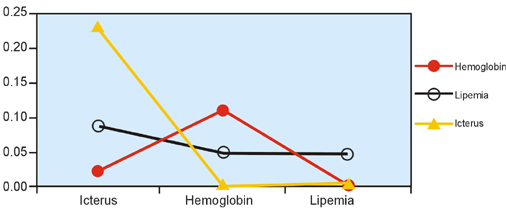
The following schematic illustrates the absorbance characteristics at the three wavelength settings for the three individual compounds.
Absorbance of Standard Solutions
|
Absorbance |
|
Wavelength
Using standard solutions, it appears that only the lipemia wavelength (658 nm) is specific for the lipemic interference and is independent of the other compounds. It can be seen that lipemia contributes to both the hemolysis and icterus absorbances. Using established factors, the system can make appropriate corrections.
For example:
At the icterus wavelength (478 nm), the bilirubin absorbance contains the accumulative effect of all three compounds. At the hemolysis wavelength (571 nm), the hemolysis absorbance contains the accumulative effect of hemolysis and lipemia. Therefore, the correction Factors d, e, and f are applied to compensate for these non-specific absorbance contributions at the icterus and hemolysis wavelengths.
Factors a, b, and c are the "calibration factors" by which the corrected absorbances are related to the qualitative flags.
The following table summarizes the application of each factor.
|
Factor |
Explanation |
|
f |
Corrects the icteric absorbance for the presence of lipemia. Example: Absorbance of lipemia at ICTE wavelength is approximately 2.5 times the absorbance of lipemia at the LIPE wavelength. |
|
d |
Corrects the hemolytic absorbance for the presence of lipemia. Example: Absorbance of lipemia at HEME wavelength is approximately 1.1 times the absorbance of lipemia at the LIPE wavelength. |
|
e |
Corrects the icteric absorbance for the presence of hemolysis, which in turn is corrected for the presence of lipemia. Example: Corrected absorbance of hemolysis at the ICTE wavelength is approximately 0.5 times the corrected absorbance of hemolysis at the HEME wavelength. |
|
a, b, and c |
Calibration factors applied to the absorbance of lipemia, hemolysis, and icterus, respectively. |
An important consideration is that a, b, and c will vary depending on the standard materials tested and on the method used to perform the indices.
Factors d, e, and f should not vary greatly with respect to method, but may change with different standard materials.
The Serum Indices are a qualitative guide to the appearance of samples. Do not use them as an indirect measure of lipids, hemoglobin, or bilirubin.
The Lipemic index can be influenced by the presence of turbidity that may mimic a LIPE index value.
Samples containing extremely high bilirubin concentrations or samples showing gross hemolysis may produce non-specific LIPE flags.
Establish factor a using the following formula:
Factor a = "relative concentration of Lipemia standard" / Abs @ LIPE
Estimate Lipemia Index of unknown sample using the following formula:
Lipemia = factor a x Abs @ LIPE
Lipemia Index is calculated according to the entered Qualitative Judgment Settings.
Establish factor b using the following formula:
Factor b = concentration of hemolytic standard / Abs @ HEME
Corrected Abs @ HEME = Abs @ HEME - factor d (approx. 1.1) x Abs @ LIPE
Estimate Hemolysis Index of unknown sample using the following formula:
Hemolysis = factor b x corrected Abs @ HEME
Hemolytic Index is calculated according to the entered Qualitative Judgement Settings.
Establish factor c using the following:
Factor c = concentration of icteric standard / Abs @ ICTE
Corrected Abs @ ICTE = Abs @ ICTE - [ factor e (approx. 0.5) x Abs @ HEME - factor d (approx. 1.1) x Abs @ LIPE ] - factor f (approx. 2.5) x Abs @ LIPE
Estimate Icteric Index of unknown sample using the following:
Icterus = factor c x corrected Abs @ ICTE
Icteric Index is calculated according to the entered Qualitative Judgment Settings.
The Qualitative Judgment Settings are based on five ranges of interfering substance. The values displayed in the settings were established using solutions of hemoglobin and bilirubin. However, lipemia settings are based on an arbitrary triglyceride concentration that produced the desired lipemic appearance.
NOTE
Refer to the Methods Directory for examples of lipemic sample flagging, hemolyzed sample flagging, and icteric sample flagging.