Select the Test Name button  to
view the detailed information.
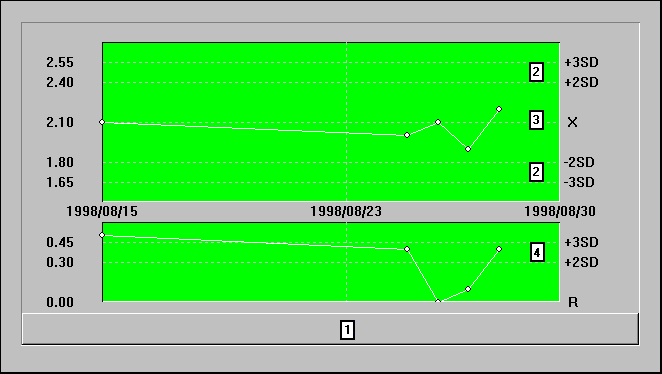
Daily control averages (upper chart)
· The daily control averages are plotted on the upper chart.
· An omitted daily control average is colored in red.
· Guidelines extend from the vertical axis at concentrations corresponding to the control mean (X), the ±2 SD limits, and the ±3 SD limits.
· The
±2 SD and ±3 SD limits  are
calculated from the QC Cumulative SD entry at the
Control Data Setup window.
· The
control mean value  is
obtained from the QC Cumulative Average entry at the Control Data Setup
window.
· A maximum of 63 data points from the daily QC are displayed in cumulative QC graphs.
Daily fluctuation ranges (lower chart)
· The daily fluctuation ranges are plotted on the lower chart.
· Each data point represents the difference between the daily QC and the established cumulative QC mean.
· Guidelines extend from the vertical axis at concentrations corresponding the +2 and +3 SD limits.
· The
+2 and +3 SD limits  are
calculated from the QC Cumulative SD entry at the Control Data Setup window.