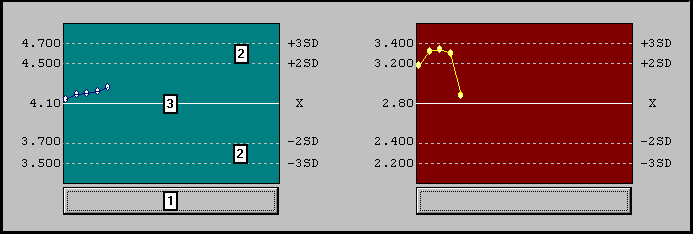
Daily control charts
|
|
About the Daily Control charts:
· Each control result is plotted on a Levey-Jennings type chart.
· A maximum of 200 control sample results are managed. If additional control samples are run, the oldest control sample results are replaced with the newer results. Omitted control results are colored red.
· Select
the Test Name button  to
view the detailed information.
· Guidelines extend from the vertical axis at concentrations corresponding to the control mean (X), the ±2 SD limits, and the ±3 SD limits.
· The
±2 SD and ±3 SD limits  are
calculated from the Daily QC SD
entry at the Control Data Setup
window.
· The
control mean value  is
obtained from the Daily QC Average
entry at the Control Data Setup
window.