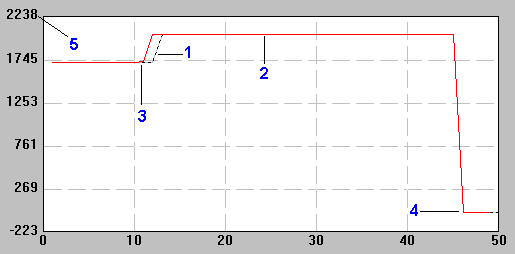
1 Maximum value of measurements.
2 Minimum value of measurements.
3 Point of liquid surface detection.
4 Liquid no longer detected.
5 Automatic y-axis scale.

The Liquid Level Sensor Monitor window contains three graphs which display the waveforms of the DPP, RPP1, and RPP2 probes over time (in seconds). The most recent LLS graph from the DPP, RPP1, or RPP2 are displayed. Scroll down the list on the left to search the data
· Review the reference value, the bias value, and the liquid sensor value.
· (Optional) Change the scale
· (Optional) Switch reagent monitors
· Liquid surface detection is indicated by a rise in the graph. When the change in this rise is not greater than the bias value, the sensor judges that no liquid is present.
· When the sensor no longer detects the liquid surface, there is a sharp drop in the graph.
|
1 Maximum value of measurements. 2 Minimum value of measurements. 3 Point of liquid surface detection. 4 Liquid no longer detected. 5 Automatic y-axis scale. |
|