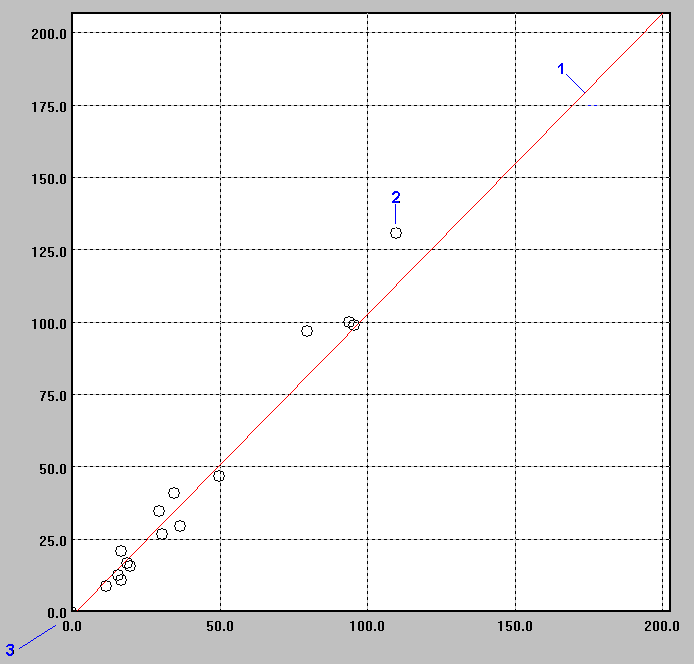
1 The line indicates the correlation, as measured by the slope and intercept.
2 Each selected test sample is plotted on the chart.
3 The scale is based on the range of measurements found in the selected test samples.
Note on the x-axis and y-axis
Return to the Correlation window